
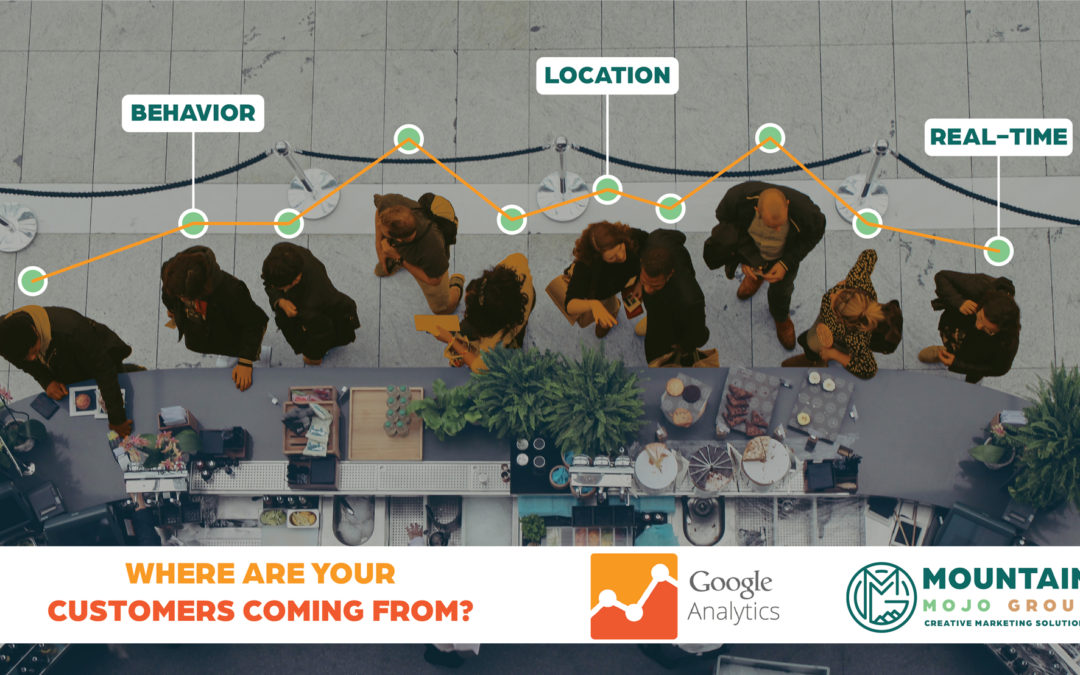
So you have a website…check! Now it’s time to move onto your next marketing tactic, right? Before you do that, how is your website doing? How many people are visiting? Are they doing what you want them to do? Where are they coming from? How old are they?
If you’ve asked these questions before, the battle is half won. Lucky for you, with this quick introduction to Google Analytics and a little advice from the Mojo team, you’ll be on your way to being able to answer those questions for yourself.
Google Analytics? Huh?
Google Analytics (or known as GA by the cool kids today) is a free website analytics tool provided by Google to help you analyze your website traffic, basic demographic information about your users, and provide you with key data to determine the success of your website’s presence in the world. Said another way, Google Analytics is the best tool to peer into the heads of your website’s visitors and will help you figure out a direction for your website and who you should be marketing to online.
To some, Google Analytics might seem hyperbolic — the “snake oil” peddled by digital marketers all over the world.
As both a marketing professional and small-business owner, I’m here to tell you that Google Analytics is the best tool in your toolbox to market effectively to your customer-base online and save time and resources.
Why do I need GA? What’s in it for me?
Google Analytics is your source for figuring out the who, the what, and the where for your website traffic. If you are a brick-and-mortar store, you can see what your online customers might purchase when they actually visit. If you sell products online, you can understand how customers found your store and what products they are most likely to purchase if they come from a specific data source.
Google Analytics allows you to understand your customer behavior and what they like (and dislike) about your site. More importantly, Google Analytics provides the data so you can cater your business and marketing direction to address your customers needs.
Without analyzing your website traffic, you will have to rely on a multitude of other sources to figure out who your customers are, what they are interested in, and how they found your business. By properly using Google Analytics, you can find out that information (and more) all in one place- and for free! What a world we live in!
So Let’s Dive In!
Before we go further, we recommend that you actually install Google Analytics on your website. There are two things that you need before installing it on your website: access to the back-end of your current website and a Gmail email address.
For a step-by-step guide on how to install Google Analytics on your website, click here for instructions:
How to set up Google Analytics:
The Reports – Purpose and what you can gain from each one:
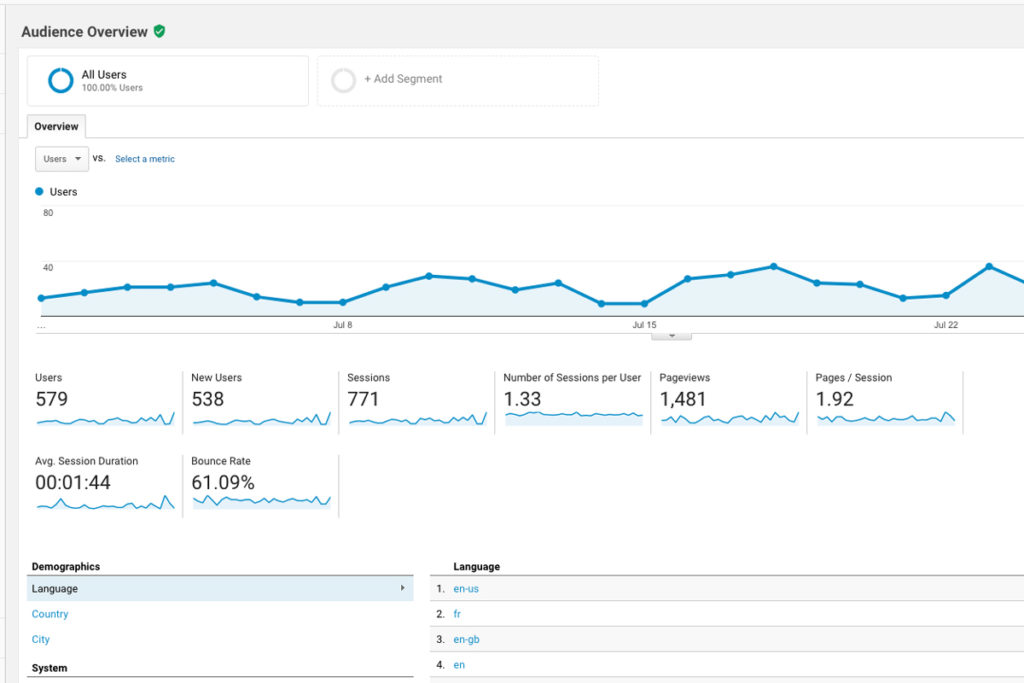
Once you have successfully installed Google Analytics on your site, sign into your account (analytics.google.com) and go to your profile. Your dashboard will look something like this:
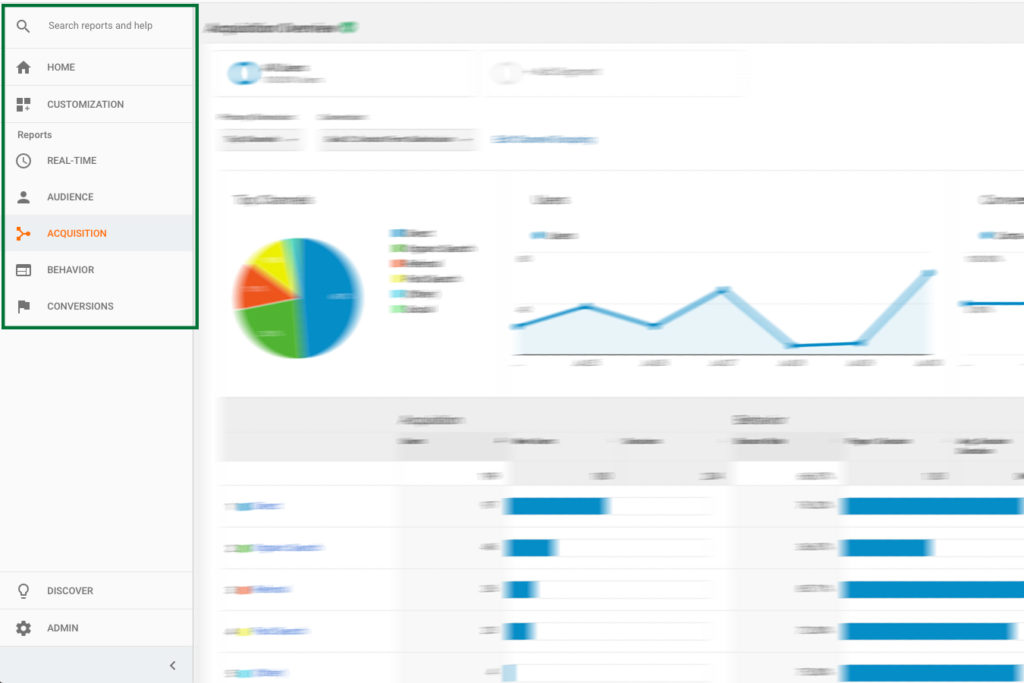
Since this is an introduction to Google Analytics, we are going to cover the “Reports” portion of the dashboard. The Reports are found on the left-hand side of the screen and are broken into several sections that are listed below.
There are many other features to Google Analytics but Reports are a great place to start because they provide so much information that is crucial for understanding how your users interact with your website and who they are and where they are coming from.
Real-Time
Real-Time reports allow you to see current visitors to your site right now. Open up a new tab, and go to your website to watch magic take place. Within a few seconds, Google Analytics should be able to tell you what city you are currently located in, what specific web page you are on, and how you got to the website in the first place.
These types of reports are great to use the minute you send out an e-blast or post something to your social media account. It’s an exciting way to watch what specific visitors are doing in real-time on your website.
While it’s hard to gather any specific data from this type of report, for me and my small business, it’s fun to watch where users go on your site and you can literally watch them sit on specific pages. I tend to deduct information like “Boy, these guys are sitting on the ‘services’ page for a long time. They must be reading through everything,” or “They spent two seconds on the ‘about us’ page…maybe I need to add more pictures and copy to keep them engaged longer on that specific page.”
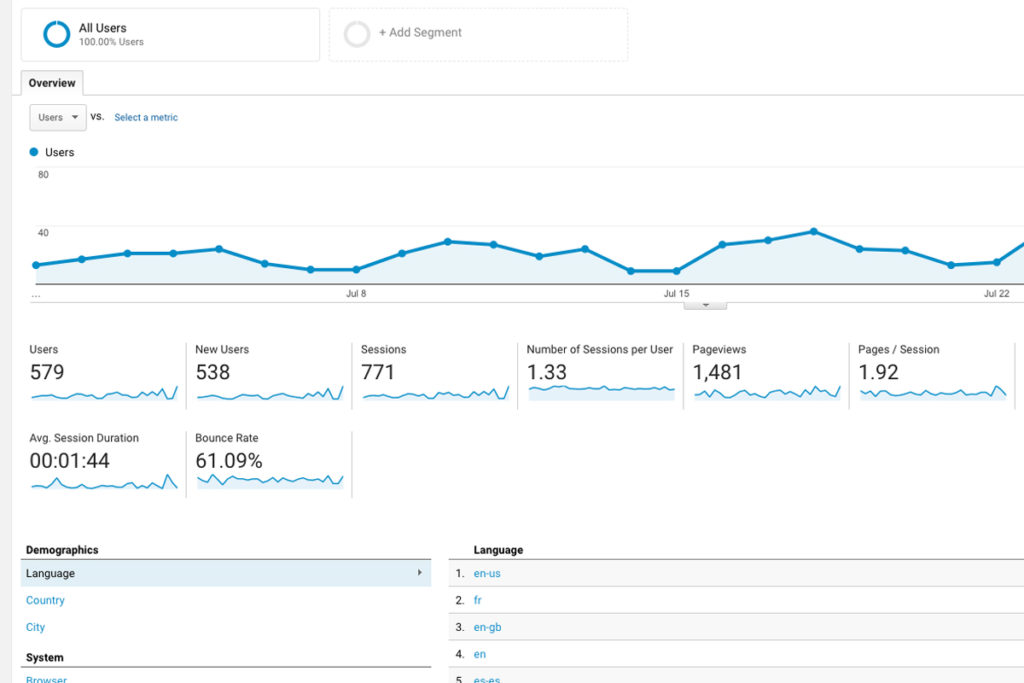
Audience
The two reports that you are going to spend the most time in are the “Audience” and “Acquisition” reports. The Audience report provides the most information about your website visitors. This report answers the question of “who” is visiting your website. The Overview tab of the Audience report will give you a snapshot summary of how many visitors, pages, and the average length of visit your website received over a given period of time.
Moving to other tabs in the Audience report, you can start to see into demographic data of your typical website visitor. This includes age, gender, location, technology (computer/mobile phone, what internet provider, and device), as well as, the interests of your visitors.
We could feature a full series of how to understand and use this report; it is a goldmine of data. It is not uncommon for our clients to have a “business identity crisis” after viewing this data.
We’ve heard things like this after reviewing the data:
- “I had no idea that people 18-24 were more interested in my products than my target age group of 34+.”
- “It’s crazy to me that people who live 400 miles away are interested in what I do”
This report will shine a light on your website visitors and can help you fix your marketing strategy to attract your target customers, build new marketing campaigns to reach new customers, or provide inspiration to create or sell new products or services based on who is actually visiting your site.
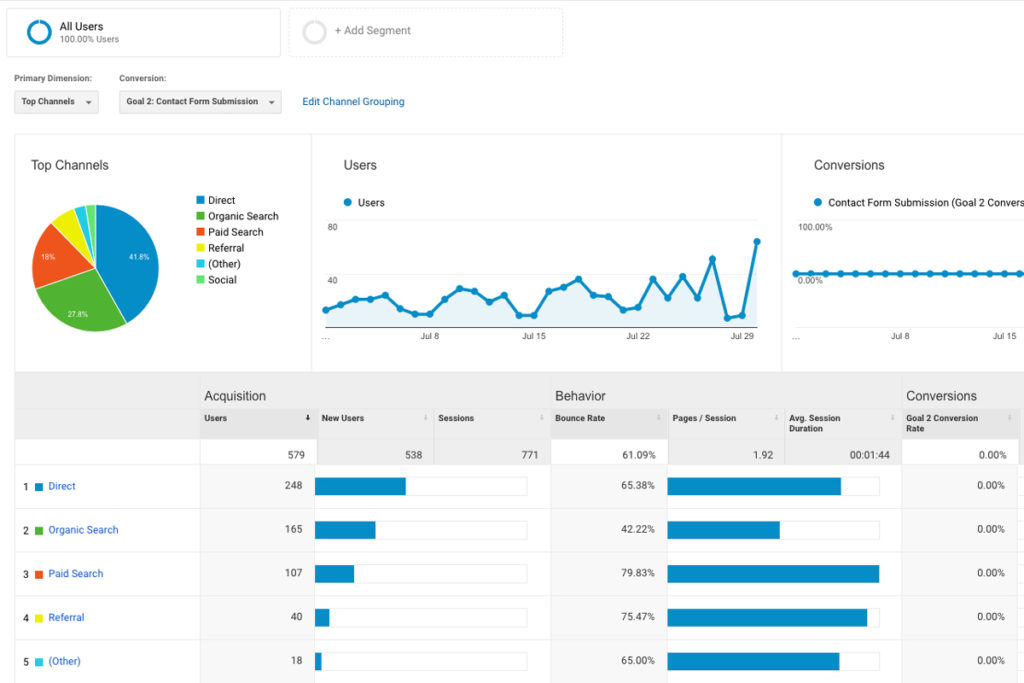
Acquisition
The Acquisition reports illustrate how users found your website and where they came from specifically. The Acquisition report provides the “where” and “how” users found your site. The Overview tab will give you a breakdown of specific channels including organic search, paid search, social, and direct searches.
Organic searches are searches that are performed on Google using a specific search query. I.e., “dog kennels in northern Arizona.” If someone clicked on your site from that search query, it is then called an organic search.
Paid searches are searches that are the result of a user clicking on an AdWords listing (visiting our PPC page for more details on how AdWords works [LINK]).
Social searches are clicks from specific social media pages onto your site. If someone clicks on your website URL from Facebook, it will be considered a social search.
Direct searches are searches that result from a user literally typing in your URL into their browser window. If I go and type in “mountainmojogroup.com” into my browser, it will be considered a direct search.
As you click through and dig deeper into the Acquisition report, you will see more specifically where and how users got to your site. While our description of this type of report is very shallow, you can still gather a lot of information on what specific marketing campaigns or ideas are working for your business. If you are noticing a lot of visits are coming from Facebook, your Facebook marketing strategy is working! If you aren’t seeing a lot of visits from organic searches, time to consult an SEO specialist to beef up your website’s ranking!
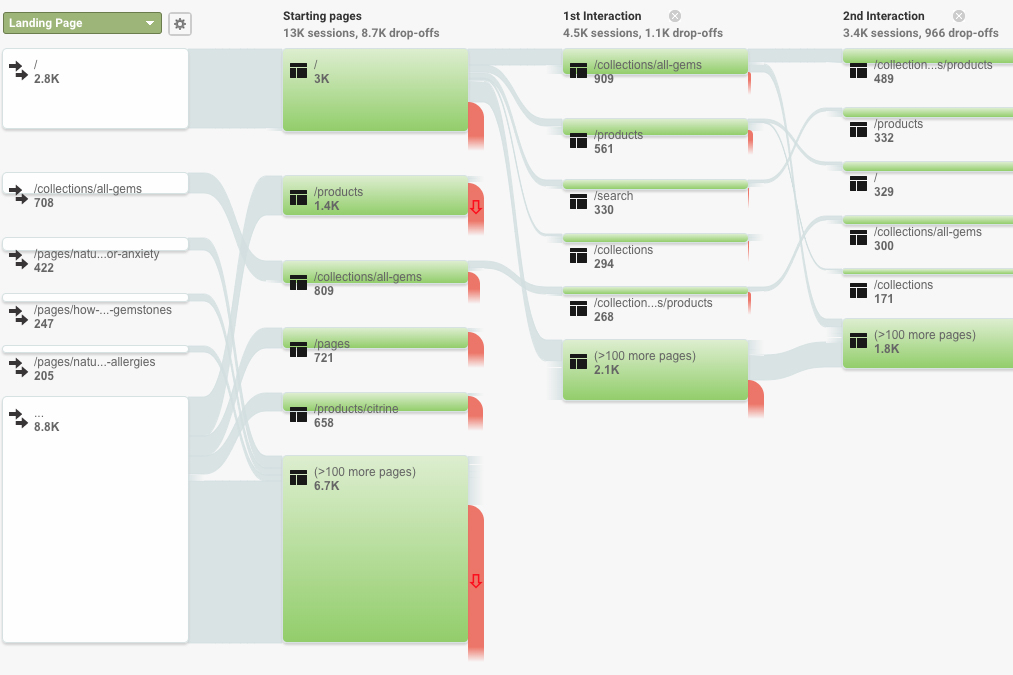
Behavior
At first glance, the Behavior report may look very similar to the Audience report. Underneath the Overview tab, is the “Behavior Flow” report. A lot of our clients begin drooling upon looking at this report in detail because of just how much information this section provides on how users explore your site.
The Behavior Flow report shows the pathway of your users from start to finish on your site. It is a visual map of what your users did when they visited your site. We recommend that you dig into this report and spend time looking through pathways to see what your users are doing. You can gather a lot of information about your website. For example, if users are leaving straight from the homepage, maybe they are bored! Adding more content may encourage users to click on other features and go deeper into your site.
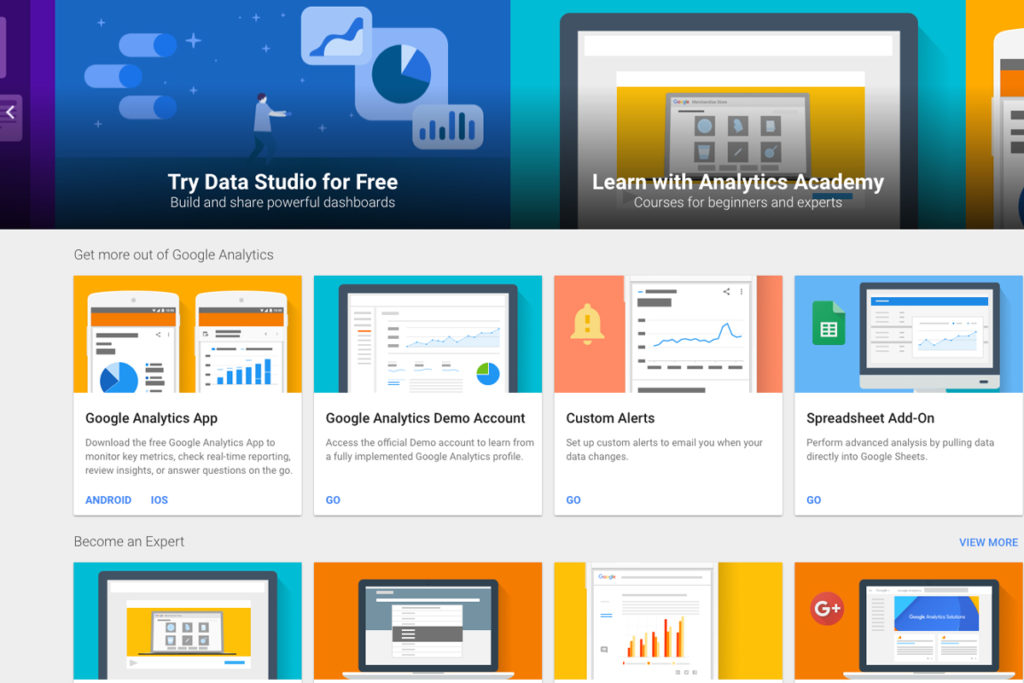
Discover
The Discover tab is really a collection of Google Analytics resources, apps, and training information. If you wanted to learn more about specific features of reports or keep up-to-date with changes to Google Analytics, the Discover tab is the place to start!
Admin
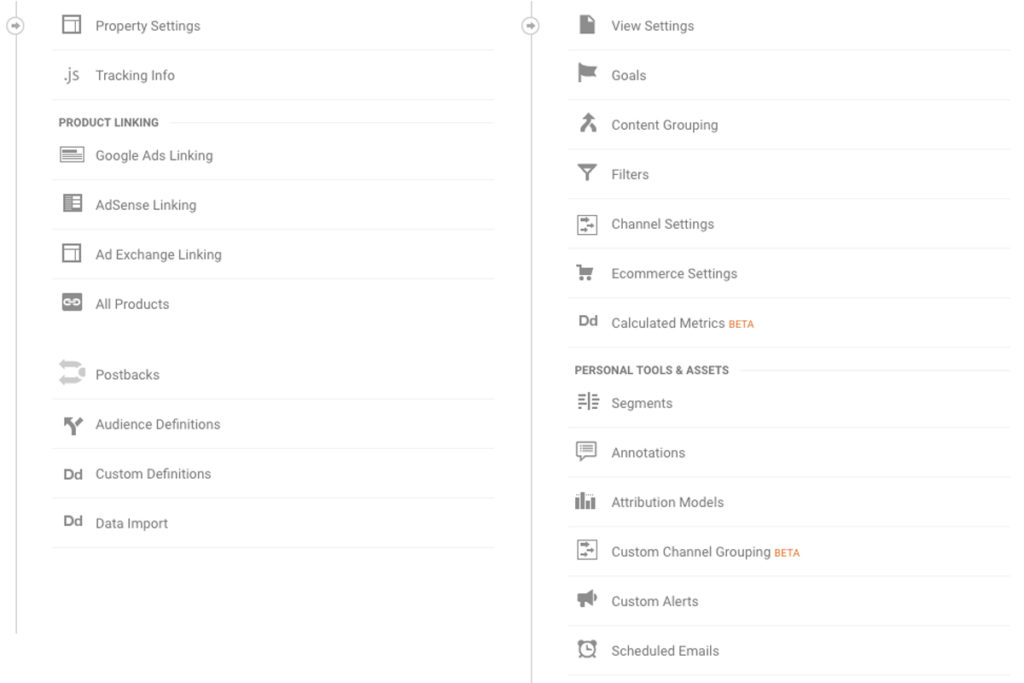
The Admin tab should be somewhat familiar to you – assuming that you set-up your Google Analytics account initially. This tab is where you can find the “settings” for your profile and account. If you need to add a new user to the account, change your website’s URL for the profile, or change the account name, the Admin tab is where you will find those settings.
We highly recommend that you set up a filter to exclude your home or office computers from being tracked in your Google Analytics data. It takes five minutes to accomplish and is extremely easy to set up.
How to exclude your home or office from Google Analytics:
Summary
Simply put, if you have a website, Google Analytics is the best marketing tool that is available on the entire web. It can help you understand the “who,” “where,” and “how” of your website’s visitors. It allows you to peer into your visitors’ heads and give you a direction on how to improve, expand, and change your website and your online marketing strategy.
Our team at Mojo uses Google Analytics every week to steer our online marketing ship- without Google Analytics, our ship would have run aground and we would have wasted hundreds of hours trying to figure out how to get our marketing ship back on course. Plain and simple, if you have a website, you need Google Analytics!
If you what to learn more about how Google Analytics can work for your website or want to see how far down the data rabbit hole you can go, contact the Google-certified team at Mojo!
Mountain Mojo Group is located in Flagstaff, Williams, the White Mountains, and Page, Arizona and provides top-quality marketing solutions and design! Our team works with small businesses all across the state of Arizona, providing a variety of marketing and design services including, social media management, photography, videography, strategy, web design, graphic design, SEO, and paid search engine marketing. Our team of creatives is ready to tackle your next marketing project. Contact our team today at (928) 440-5301 or stop by one of our offices located throughout northern Arizona.